ثبت نام / ورود
0
ثبت نام / ورود
0
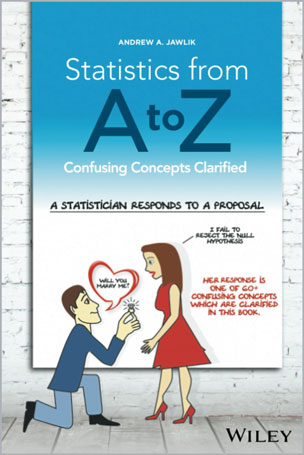
Confusing Concepts Clarified
Andrew A. Jawlik
#Statistics
#AtoZ
Statistics is confusing, even for smart, technically competent people. And many students and professionals find that existing books and web resources don’t give them an intuitive understanding of confusing statistical concepts. That is why this book is needed. Some of the unique qualities of this book are:
• Easy to Understand: Uses unique “graphics that teach” such as concept flow diagrams, compare-and-contrast tables, and even cartoons to enhance “rememberability.”
• Easy to Use: Alphabetically arranged, like a mini-encyclopedia, for easy lookup on the job, while studying, or during an open-book exam.
• Wider Scope: Covers Statistics I and Statistics II and Six Sigma Black Belt, adding such topics as control charts and statistical process control, process capability analysis, and design of experiments. As a result, this book will be useful for business professionals and industrial engineers in addition to students and professionals in the social and physical sciences.
In addition, each of the 60+ concepts is covered in one or more articles. The 75 articles in the book are usually 5–7 pages long, ensuring that things are presented in “bite-sized chunks.” The first page of each article typically lists five “Keys to Understanding” which tell the reader everything they need to know on one page. This book also contains an article on “Which Statistical Tool to Use to Solve Some Common Problems”, additional “Which to Use When” articles on Control Charts, Distributions, and Charts/Graphs/Plots, as well as articles explaining how different concepts work together (e.g., how Alpha, p, Critical Value, and Test Statistic interrelate).
Table of Contents
ALPHA, 𝜶
ALPHA AND BETA ERRORS
ALPHA, p, CRITICAL VALUE, AND TEST STATISTIC – HOW THEY WORK TOGETHER
ALTERNATIVE HYPOTHESIS
ANALYSIS OF MEANS (ANOM)
ANOVA – PART 1: WHAT IT DOES
ANOVA – PART 2: HOW IT DOES IT
ANOVA – PART 3: 1-WAY (AKA SINGLE FACTOR)
ANOVA – PART 4: 2-WAY (AKA 2-FACTOR)
ANOVA vs. REGRESSION
BINOMIAL DISTRIBUTION
CHARTS/GRAPHS/PLOTS – WHICH TO USE WHEN
CHI-SQUARE – THE TEST STATISTIC AND ITS
DISTRIBUTIONS
CHI-SQUARE TEST FOR GOODNESS OF FIT
CHI-SQUARE TEST FOR INDEPENDENCE
CHI-SQUARE TEST FOR THE VARIANCE
CONFIDENCE INTERVALS – PART 1: GENERAL CONCEPTS
CONFIDENCE INTERVALS – PART 2: SOME SPECIFICS
CONTROL CHARTS – PART 1: GENERAL CONCEPTS AND PRINCIPLES
CONTROL CHARTS – PART 2: WHICH TO USE WHEN
CORRELATION – PART 1
CORRELATION – PART 2
CRITICAL VALUE
DEGREES OF FREEDOM
DESIGN OF EXPERIMENTS (DOE) – PART 1
DESIGN OF EXPERIMENTS (DOE) – PART 2
DESIGN OF EXPERIMENTS (DOE) – PART 3
DISTRIBUTIONS – PART 1: WHAT THEY ARE
DISTRIBUTIONS – PART 2: HOW THEY ARE USED
DISTRIBUTIONS – PART 3: WHICH TO USE WHEN
ERRORS – TYPES, USES, AND INTERRELATIONSHIPS
EXPONENTIAL DISTRIBUTION
F
FAIL TO REJECT THE NULL HYPOTHESIS
HYPERGEOMETRIC DISTRIBUTION
HYPOTHESIS TESTING – PART 1: OVERVIEW
HYPOTHESIS TESTING – PART 2: HOW TO
INFERENTIAL STATISTICS
MARGIN OF ERROR
NONPARAMETRIC
NORMAL DISTRIBUTION
NULL HYPOTHESIS
p, p-VALUE
p, t, AND F: “>”OR “<”?
POISSON DISTRIBUTION
POWER
PROCESS CAPABILITY ANALYSIS (PCA)
PROPORTION
r, MULTIPLE R, r2, R2, R SQUARE, R2 ADJUSTED
REGRESSION – PART 1: SUMS OF SQUARES
REGRESSION – PART 2: SIMPLE LINEAR
REGRESSION – PART 3: ANALYSIS BASICS
REGRESSION – PART 4: MULTIPLE LINEAR
REGRESSION – PART 5: SIMPLE NONLINEAR
REJECT THE NULL HYPOTHESIS
RESIDUALS
SAMPLE, SAMPLING
SAMPLE SIZE – PART 1: PROPORTIONS FOR COUNT DATA
SAMPLE SIZE – PART 2: FOR MEASUREMENT/
CONTINUOUS DATA
SAMPLING DISTRIBUTION
SIGMA
SKEW, SKEWNESS
STANDARD DEVIATION
STANDARD ERROR
STATISTICALLY SIGNIFICANT
SUMS OF SQUARES
t – THE TEST STATISTIC AND ITS DISTRIBUTIONS
t-TESTS – PART 1: OVERVIEW
t-TESTS – PART 2: CALCULATIONS AND ANALYSIS
TEST STATISTIC
VARIABLES
VARIANCE
VARIATION/VARIABILITY/DISPERSION/SPREAD
WHICH STATISTICAL TOOL TO USE TO SOLVE SOME
COMMON PROBLEMS
Z
Andrew A. Jawlik received his B.S. in Mathematics and his M.S. in Mathematics and Computer Science from the University of Michigan. He held jobs with IBM in marketing, sales, finance, and information technology, as well as a position as Process Executive. In these jobs, he learned how to communicate difficult technical concepts in easy - to - understand terms. He completed Lean Six Sigma Black Belt coursework at the IASSC - accredited Pyzdek Institute. In order to understand the confusing statistics involved, he wrote explanations in his own words and graphics. Using this material, he passed the certification exam with a perfect score. Those statistical explanations then became the starting point for this book.