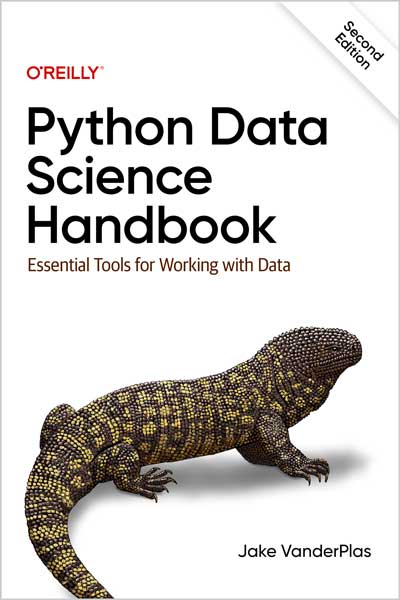
Essential Tools for Working with Data
Jake VanderPlas
#Python
#Data_Science
#Data
#Handbook
#IPython
#NumPy
#Pandas
#Matplotlib
#Scikit-Learn
#Jupyter
#ndarray
#DataFrame
#machine_learning
🐍 پایتون یک ابزار درجه یک برای بسیاری از پژوهشگران است، عمدتاً به دلیل کتابخانههایش برای ذخیرهسازی، دستکاری و استخراج بینش از دادهها.
📚 منابع متعددی برای هر بخش از این پشته دادهکاوی وجود دارد، اما تنها با نسخه جدید کتاب Python Data Science Handbook میتوانید همه آنها را یکجا داشته باشید—از جمله IPython، NumPy، pandas، Matplotlib، Scikit-Learn و دیگر ابزارهای مرتبط.
👨🔬 دانشمندان و تحلیلگران دادهای که با کدنویسی پایتون آشنا هستند، نسخه دوم این مرجع جامع را برای حل مسائل روزمره ایدهآل خواهند یافت: دستکاری، تبدیل و پاکسازی دادهها؛ مصورسازی انواع دادهها؛ و استفاده از دادهها برای ساخت مدلهای آماری یا یادگیری ماشین.
📖 به سادگی، این کتاب یک مرجع ضروری برای محاسبات علمی در پایتون است.
💡 با این کتاب، شما یاد خواهید گرفت که:
⚡ IPython و Jupyter محیطهای محاسباتی برای دانشمندانی که از پایتون استفاده میکنند فراهم میکنند.
📊 NumPy شامل ndarray برای ذخیرهسازی و دستکاری کارآمد آرایههای دادهای متراکم است.
📈 Pandas شامل DataFrame برای ذخیره و دستکاری دادههای برچسبدار/ستونی بهطور بهینه است.
🎨 Matplotlib قابلیتهای متنوعی برای مصورسازی دادهها ارائه میدهد.
🤖 Scikit-Learn به شما کمک میکند پیادهسازیهای کارآمد و تمیز از الگوریتمهای اصلی و شناختهشده یادگیری ماشین در پایتون بسازید.
👥 مخاطبان کتاب
🎓 در آموزشهای دانشگاه واشنگتن و کنفرانسهای مختلف فناوری، معمولترین سؤال این است: «چطور باید پایتون را یاد بگیرم؟»
💻 پرسشکنندگان معمولاً دانشجویان، توسعهدهندگان یا پژوهشگرانی با زمینه قوی در برنامهنویسی و ابزارهای محاسباتی هستند.
📌 بیشتر آنها نمیخواهند صرفاً پایتون یاد بگیرند، بلکه هدفشان استفاده از زبان بهعنوان ابزاری برای علوم داده و محاسبات است.
📊 علوم داده چیست؟
❓ علوم داده چیست؟ تعریف دقیق آن دشوار است، زیرا اصطلاح به شدت رایج شده است.
⚠️ برخی آن را فقط برچسبی اضافی یا یک واژه جذاب برای رزومه میدانند، اما در واقع این حوزه مجموعهای میانرشتهای از مهارتهاست که در صنایع و دانشگاهها اهمیت فزایندهای پیدا کرده است.
🌐 علوم داده شامل سه حوزه همپوشان است:
1️⃣ مهارتهای آماری برای مدلسازی و خلاصهسازی دادهها
2️⃣ مهارتهای علوم کامپیوتر برای ذخیره، پردازش و مصورسازی دادهها
3️⃣ تخصص حوزهای برای طرح پرسشهای درست و تحلیل نتایج
🚀 با این دیدگاه، علوم داده نه یک حوزه دانش جدید، بلکه مجموعهای از مهارتهاست که میتوانید در زمینه تخصصی خود به کار ببرید.
📈 هدف کتاب این است که به شما توانایی پرسش و پاسخ به سؤالات جدید در حوزه انتخابیتان را بدهد، چه در انتخابات، پیشبینی بورس، بهینهسازی تبلیغات آنلاین، شناسایی میکروارگانیسمها، نجوم یا هر زمینه دیگری.
👤 درباره نویسنده
Jake VanderPlas مهندس نرمافزار در Google Research است و ابزارهایی برای پژوهشهای دادهمحور ایجاد میکند.
- 🛠 او ابزارهای پایتون برای علوم دادهای از جمله Scikit-Learn، SciPy، AstroPy، Altair و JAX توسعه داده و در کنفرانسهای علوم داده آموزش و سخنرانی ارائه میدهد.
Python is a first-class tool for many researchers, primarily because of its libraries for storing, manipulating, and gaining insight from data. Several resources exist for individual pieces of this data science stack, but only with the new edition of Python Data Science Handbook do you get them all—IPython, NumPy, pandas, Matplotlib, Scikit-Learn, and other related tools.
Working scientists and data crunchers familiar with reading and writing Python code will find the second edition of this comprehensive desk reference ideal for tackling day-to-day issues: manipulating, transforming, and cleaning data; visualizing different types of data; and using data to build statistical or machine learning models. Quite simply, this is the must-have reference for scientific computing in Python.
With this handbook, you'll learn how:
- IPython and Jupyter provide computational environments for scientists using Python
- NumPy includes the ndarray for efficient storage and manipulation of dense data arrays
- Pandas contains the DataFrame for efficient storage and manipulation of labeled/columnar data
- Matplotlib includes capabilities for a flexible range of data visualizations
- Scikit-learn helps you build efficient and clean Python implementations of the most important and established machine learning algorithms
Table of Contents
Part I. Jupyter: Beyond Normal Python
Chapter 1. Getting Started in IPython and Jupyter
Chapter 2. Enhanced Interactive Features
Chapter 3. Debugging and Profiling
Part II. Introduction to NumPy
Chapter 4. Understanding Data Types in Python
Chapter 5. The Basics of NumPy Arrays
Chapter 6. Computation on NumPy Arrays: Universal Functions
Chapter 7. Aggregations: min, max, and Everything in Between
Chapter 8. Computation on Arrays: Broadcasting
Chapter 9. Comparisons, Masks, and Boolean Logic
Chapter 10. Fancy Indexing
Chapter 11. Sorting Arrays
Chapter 12. Structured Data: NumPy's Structured Arrays
Part III. Data Manipulation with Pandas
Chapter 13. Introducing Pandas Objects
Chapter 14. Data Indexing and Selection
Chapter 15. Operating on Data in Pandas
Chapter 16. Handling Missing Data
Chapter 17. Hierarchical Indexing
Chapter 18. Combining Datasets: concat and append
Chapter 19. Combining Datasets: merge and join
Chapter 20. Aggregation and Grouping
Chapter 21. Pivot Tables
Chapter 22. Vectorized String Operations
Chapter 23. Working with Time Series
Chapter 24. High-Performance Pandas: eval and query
Part IV. Visualization with Matplotlib
Chapter 25. General Matplotlib Tips
Chapter 26. Simple Line Plots
Chapter 27. Simple Scatter Plots
Chapter 28. Density and Contour Plots
Chapter 29. Customizing Plot Legends
Chapter 30. Customizing Colorbars
Chapter 31. Multiple Subplots
Chapter 32. Text and Annotation
Chapter 33. Customizing Ticks
Chapter 34. Customizing Matplotlib: Configurations and Stylesheets
Chapter 35. Three-Dimensional Plotting in Matplotlib
Chapter 36. Visualization with Seaborn
Part V. Machine Learning
Chapter 37. What Is Machine Learning?
Chapter 38. Introducing Scikit-Learn
Chapter 39. Hyperparameters and Model Validation
Chapter 40. Feature Engineering
Chapter 41. In Depth: Naive Bayes Classification
Chapter 42. In Depth: Linear Regression
Chapter 43. In Depth: Support Vector Machines
Chapter 44. In Depth: Decision Trees and Random Forests
Chapter 45. In Depth: Principal Component Analysis
Chapter 46. In Depth: Manifold Learning
Chapter 47. In Depth: k-Means Clustering
Chapter 48. In Depth: Gaussian Mixture Models
Chapter 49. In Depth: Kernel Density Estimation
Chapter 50. Application: A Face Detection Pipeline
Who Is This Book For?
In my teaching both at the University of Washington and at various tech-focused conferences and meetups, one of the most common questions I have heard is this: “How should I learn Python?” The people asking are generally technically minded students, developers, or researchers, often with an already strong background in writing code and using computational and numerical tools. Most of these folks don’t want to learn Python per se, but want to learn the language with the aim of using it as a tool for data-intensive and computational science. While a large patchwork of videos, blog posts, and tutorials for this audience is available online, I’ve long been frustrated by the lack of a single good answer to this question; that is what inspired this book.
The book is not meant to be an introduction to Python or to programming in general; I assume the reader has familiarity with the Python language, including defining functions, assigning variables, calling methods of objects, controlling the flow of a program, and other basic tasks. Instead, it is meant to help Python users learn to use Python’s data science stack—libraries such as those mentioned in the following section, and related tools—to effectively store, manipulate, and gain insight from data.
What Is Data Science?
This is a book about doing data science with Python, which immediately begs the question: what is data science? It’s a surprisingly hard definition to nail down, especially given how ubiquitous the term has become. Vocal critics have variously dismissed it as a superfluous label (after all, what science doesn’t involve data?) or a simple buzzword that only exists to salt resumes and catch the eye of overzealous tech recruiters.
In my mind, these critiques miss something important. Data science, despite its hype-laden veneer, is perhaps the best label we have for the cross-disciplinary set of skills that are becoming increasingly important in many applications across industry and academia. This cross-disciplinary piece is key: in my mind, the best existing definition of data science is illustrated by Drew Conway’s Data Science Venn Diagram, first published on his blog in September 2010 (Figure below).
While some of the intersection labels are a bit tongue-in-cheek, this diagram captures the essence of what I think people mean when they say “data science”: it is fundamentally an interdisciplinary subject. Data science comprises three distinct and overlapping areas: the skills of a statistician who knows how to model and summarize datasets (which are growing ever larger); the skills of a computer scientist who can design and use algorithms to efficiently store, process, and visualize this data; and the domain expertise—what we might think of as “classical” training in a subject—necessary both to formulate the right questions and to put their answers in context.
With this in mind, I would encourage you to think of data science not as a new domain of knowledge to learn, but a new set of skills that you can apply within your current area of expertise. Whether you are reporting election results, forecasting stock returns, optimizing online ad clicks, identifying microorganisms in microscope photos, seeking new classes of astronomical objects, or working with data in any other field, the goal of this book is to give you the ability to ask and answer new questions about your chosen subject area.
About the Author
Jake VanderPlas is a software engineer at Google Research, working on tools that support data-intensive research. He creates and develops Python tools for use in data-intensive science, including packages like Scikit-Learn, SciPy, AstroPy, Altair, JAX, and many others. He participates in the broader data science community, developing and presenting talks and tutorials on scientific computing topics at various conferences in the data science world.
